America’s power buildout has a new MVP, and it’s the sun. Newly published data from the Federal Energy Regulatory Commission (FERC), reviewed by the SUN DAY Campaign, show solar accounted for more than three-quarters of new U.S. generating capacity added in the first nine months of 2025. In September alone, solar was a near‑clean sweep: 98% of all new capacity.
That caps 25 straight months where solar led every other energy source for new additions — a streak that started in September 2023. Big picture: renewables are on track to top 40% of installed capacity within three years, with solar alone potentially hitting 20%.
Solar isn’t just having a good month — it’s racking up a two‑year lead streak and widening the gap. Developers, utilities, and manufacturers are putting capital where the growth is. That shapes jobs, supply chains, and local tax bases. Solar’s growing share of capacity doesn’t mean it generates the most electricity (sun doesn’t shine at night), yet the sheer build rate is remaking America’s grid.
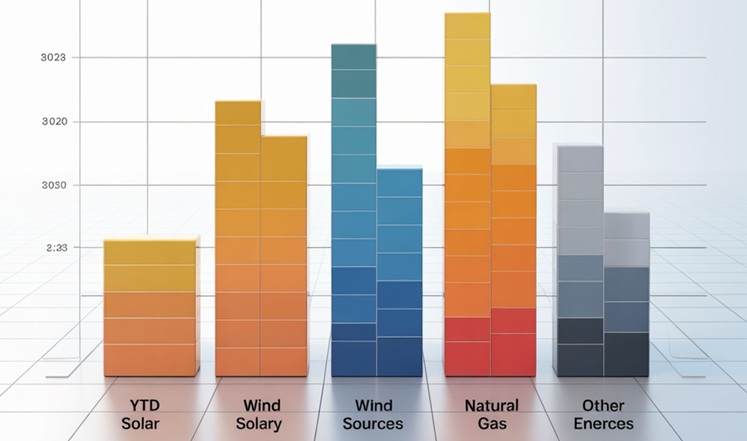
48 utility‑scale solar projects totaling 2,014 MW entered service, representing 98% of all new capacity for the month (oil made up the balance at 40 MW). 567 utility‑scale solar units added 21,257 MW — 75.3% of all new capacity. New wind additions (3,724 MW) outpaced new natural gas capacity (3,161 MW) YTD. Utility‑scale solar capacity jumped from 91.82 GW in September 2023 to 158.43 GW by September 2025. Over the same period, wind expanded by 11.07 GW and natural gas rose just 4.60 GW (net).
2025 YTD new utility-scale capacity (through Sept 30, 2025)
| Source | New capacity (MW) | Share of YTD additions |
|---|---|---|
| Solar | 21,257 | 75.3% |
| Wind | 3,724 | 13.2% |
| Natural gas | 3,161 | 11.2% |
| Hydropower | 4 | — |
| Biomass | 6 | — |
| Oil | 63 | — |
| Waste heat | 17 | — |
| Total | 28,232 | 100% |
Utility‑scale solar now accounts for 11.78% of total U.S. capacity — virtually tied with wind at 11.80%. If the current run-rate holds, FERC’s next report could show solar pulling ahead. 23.58% of total utility‑scale capacity. With hydropower (7.59%), biomass (1.05%), and geothermal (0.31%), renewables are 32.53% of U.S. utility‑scale capacity today. FERC tracks utility‑scale projects (>1 MW). More than a quarter of U.S. solar lives on rooftops and other small systems. Include those and renewables already represent more than one‑third of total capacity.
FERC’s three‑year outlook shows solar as the clear growth leader, with wind a strong second. Fossil capacity, especially coal and oil, declines on net.
| Source | High‑probability net additions, Oct 2025–Sep 2028 (MW) |
|---|---|
| Solar | 90,614 |
| Wind | 23,093 |
| Hydropower | 566 |
| Geothermal | 92 |
| Biomass | -126 |
| Natural gas | 6,667 |
| Nuclear | 335 |
| Coal | -24,011 |
| Oil | -1,587 |
Utility‑scale solar would reach an estimated 17.3% of installed capacity, trailing only natural gas (39.9%). All utility‑scale renewables combined would exceed 38% of installed capacity. Solar could top 20% and all renewables surpass 41%, while natural gas dips below 38% of total capacity.
FERC also lists “all additions” (an upper‑bound scenario). In that case over the next three years:
- Solar could add up to 232,487 MW.
- Wind could add up to 65,658 MW.
- Hydropower up to 9,927 MW; geothermal 202 MW; biomass 32 MW.
- Even in this stretch case, natural gas additions would be far smaller (29,859 MW).
Wind had an early lead in U.S. renewables; now solar’s faster build times, falling hardware costs, and broad regional fit are propelling it to the front. Capacity shares don’t equal electricity shares. Output depends on when the sun or wind is available, grid integration, and storage. Still, capacity is the scaffolding future generation is built on. According to the SUN DAY Campaign’s Ken Bossong, politics can’t rewrite the math. He criticized reported efforts to downplay “renewables” in federal branding, arguing FERC’s data show solar and wind are on a path to dominate regardless. Whatever your politics, the interconnection queues and steel‑in‑the‑ground agree: the buildout is real.
Twenty‑five months at No. 1 is not a blip — it’s a trend. With solar supplying 98% of September’s new capacity and 75% year‑to‑date, the U.S. grid is tilting toward renewables faster than many expected. If FERC’s near‑term forecast holds, solar will be the second‑largest source of installed capacity by 2028. Add in rooftops and batteries, and that future starts to look a lot like the present — just brighter.
Figures are from FERC’s “Energy Infrastructure Update” (data through Sept. 30, 2025) and the SUN DAY Campaign’s analysis. FERC tracks utility‑scale resources; small‑scale solar is estimated separately.
Related Post


